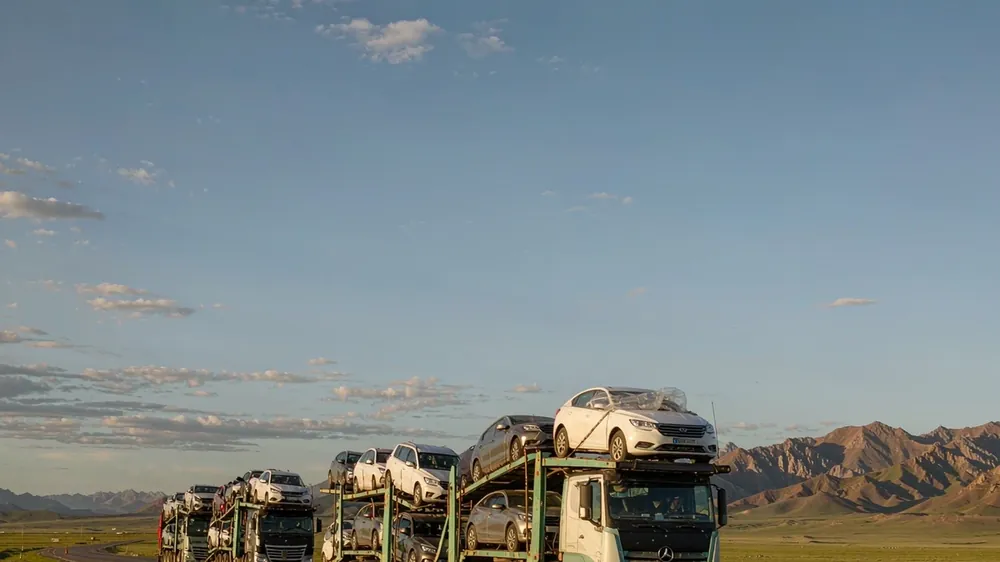
Chinese brands' 49.3% registration share and +37% year-on-year growth mean that the high share of pure exports has peaked; next, the competition is about localization and the parts system. In H1, Changan led with 23,600 units, +177%, OMODA/JAECOO have shifted to local assembly, and the vehicle localization rate is about 18%. For importers, the window of earning margins by shipping one car at a time is closing; only those who can secure CKD supply and local cooperation terms will capture the next increment; whoever lays out parts warehouses first will be the first to catch the 49.3% dividend. That is, whoever lays out parts warehouses first and secures local cooperation terms first will be the one to catch the 49.3% dividend.
The structure in H1 is 'volume rising, structure changing'. Total new car registrations in Kazakhstan were 135,700 units, +13% year-on-year, and the Chinese segment's growth rate was almost three times the overall. Changan accounted for about 35% of Chinese brands' first registrations, BYD +241% and Deepal +182% had the fastest growth, and Jetour -26% was the only top-five decline. More critically, the statistical scope: first registrations of 66,900 units are far higher than the Chinese car share in the official 105,900 dealer sales, indicating that parallel imports are still absorbing volume, but OMODA/JAECOO's shift to Astana Motors' local production line means the pure export share is starting to be diluted by local assembly. This scope reminds importers: parallel imports are still absorbing volume, but once the local production line is laid out, the pure export share will be diluted year by year.
Do the math on the shifts within 49.3%. Based on 66,900 Chinese brand units, for each additional percentage point of local assembly, pure imports lose about 669 units of landed margin space. The current 18% localization rate means about 12,000 units are taxed as CKD kits, which is superior to complete vehicle landing in terms of tariffs and quotas; according to the plan, about 2,000 more units will be assembled by the end of 2026 and 10,000 units by 2027, and the pure import share will be squeezed year by year. The conclusion is clear: the model of shipping cars over to earn FOB margins is rapidly thinning at the margin. Overlay the 18% localization rate with tariff and quota preferences into the model, and the landed advantage of pure imported cars is being eaten away bit by bit by CKD kits.
For importers, the impact falls on two lines. One is supply: pure export models still sell well, but after OMODA/JAECOO switch production, models from the same group will have dual-track pricing for 'local version' and 'import version', and stocking the wrong version will lead to unsold inventory. The other is parts: local assembly pulls commonly used parts into warehouses in Almaty and Astana, and pure importers' parts arrival cycles actually lengthen. The criterion is direct: if you can't get CKD supply prices, don't fight a price war with local production lines in the 49.3% red ocean. When secondary dealers screen new brands, they first ask two things: can you get CKD supply prices, and how long is the parts arrival cycle; if these two are not aligned, the price war is lost. Even if pure export models sell well, they can't withstand the dual-track pricing of local production lines.
Before acting, ask the supplier for two lists: first, CKD supply prices and local assembly cooperation terms (including tariff preferences corresponding to meeting the localization rate, quota caps, and settlement currency), and second, a list of commonly used spare parts and the arrival cycle for warehouses in Almaty/Astana. Then, based on Changan's 23,600 units and +177% growth rate, review the slope of your target segment over the past 6 months to see whether the minimum order quantity for regional exclusivity is reachable. If you need to confirm the CKD landed cost of a certain model and the amount for parts distribution, you can provide the VIN or configuration list to get a quote. The contract must specify the tariff preferences and quota caps corresponding to meeting the localization rate; don't leave settlement risk on your own books.
Which markets demand the most Chinese vehicles?
Latin America, Central Asia & CIS, the Middle East, Africa and the EU all show steady demand with different preferences (e.g. pickups and SUVs in Central Asia, heat-resistant models in the Middle East). EZ Auto supplies all five regions equally, without betting on a single market.
Where can I check Chinese vehicle export data?
Export volumes, destination registrations and import figures are published by China Customs and destination statistics offices. EZ Auto's News section digests the key trends so buyers can judge quickly.
How do shipping cost swings affect my purchase?
Freight is a meaningful share of landed cost and moves with capacity and fuel. EZ Auto locks the shipping method and timing at contract and quotes major pre-arrival costs to limit mid-way price changes.
How do exchange-rate swings affect export quotes?
RMB and destination-currency fluctuations affect landed cost. EZ Auto stamps a validity period on quotes, and volume orders can lock an exchange-rate window to reduce price-change risk.
Which models hold value better in target markets?
Resale value depends on local parc size, parts availability and brand recognition. EZ Auto advises model choices based on the destination's market rather than simply pushing high-margin units.
This article is published by EZ Auto. EZ Auto (Cheyixing Automobile Import & Export) specializes in exporting Chinese vehicles — new, used and parts — serving Latin America, Central Asia & CIS, Africa, the Middle East and the EU, with order-based sourcing, inspection with photo report, export documentation and ocean freight in one place.
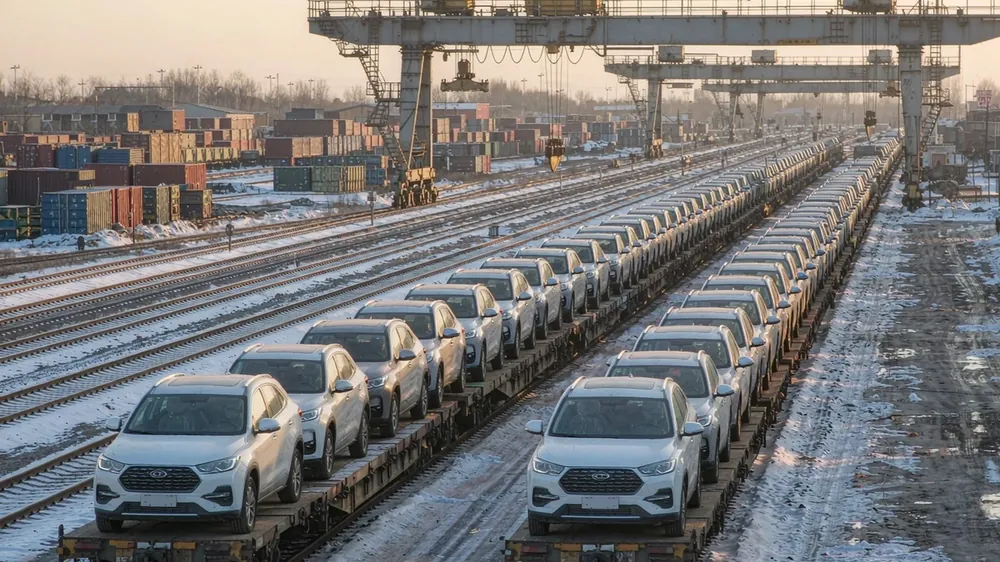 China-Russia Auto Trade Jan–Aug: How to Read the 638,000 Vehicle ExportsFrom January to August, China exported 638,000 vehicles to Russia, while local self-owned brands sold 500,000 units, acc
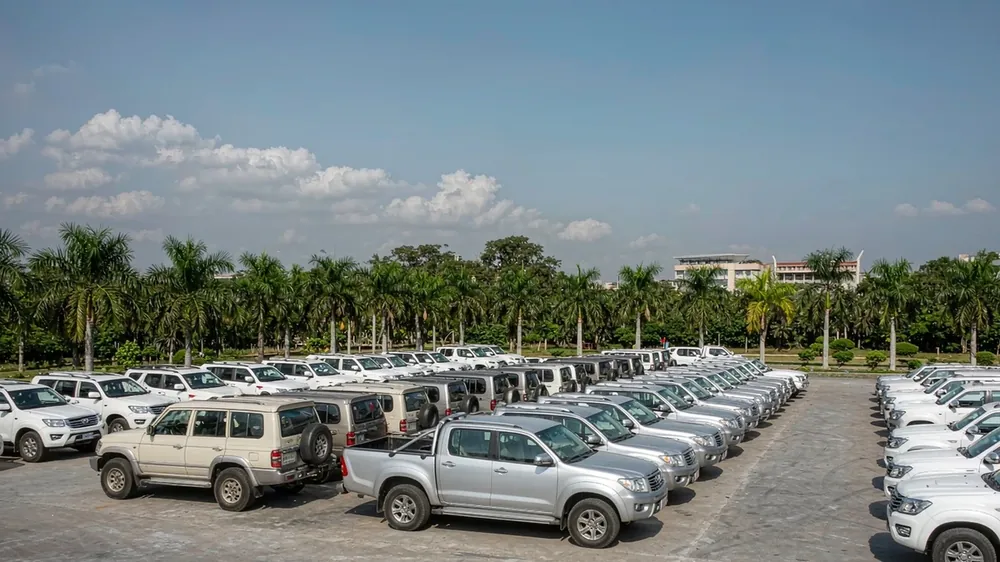 South Africa imports 390,000 light vehicles, up 28.6%: channels are scarcer than quotesIn 2025, South Africa imported 391,287 light vehicles, up 28.6% year-on-year, with India accounting for 56.2% and China
 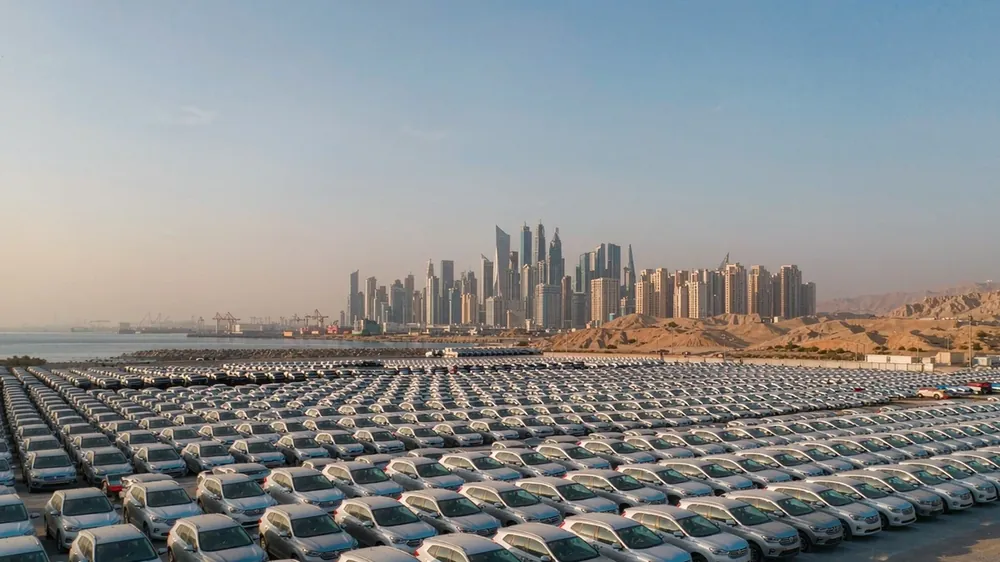 Saudi Arabia imported 1.9 million vehicles in two years, China ranks first: what's missing is channels, not carsSaudi Arabia imported about 1.9 million vehicles from 2024 to 2025, with China ranking first among source countries and
  Pakistan Vehicle Imports Up 36%: Start with Small-Batch CBU, Then Discuss CKDPakistan Bureau of Statistics data: July–August imports of new and used vehicles totaled US$81.4 million, up 36% year-on
 Chinese car imports Vietnam: the $35,300 average betVietnam imported 44,335 Chinese CBU cars worth $1.567bn in eight months: volume +45.9%, value +58.8%, average $35,300. T
Message us on WhatsApp for the latest prices and delivery to your country.
WhatsApp us