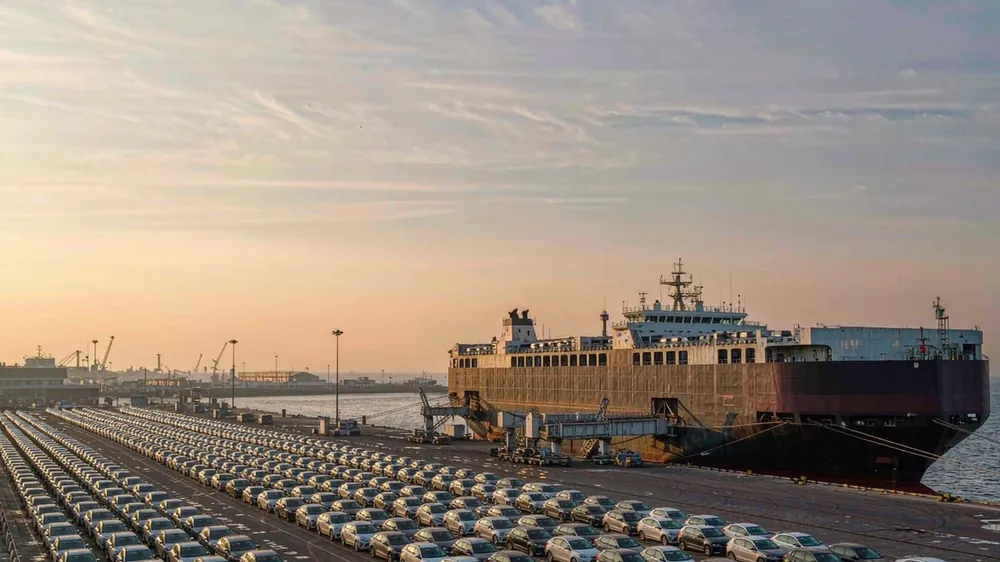
The value of port data lies not in the total volume, but in the flow of value and the price band per vehicle: the former determines whether you can still get cars, the latter means whether the cars you get can be sold. Looking at the data from Ningbo Port for the first eight months, exported new energy vehicles already account for 80.3% of the port's vehicle export value, exports to the UK multiplied 13.8 times in a year, and exports to Central and Eastern Europe grew 360.3%. Negotiating prices based on fuel vehicles and picking up bargains in small European markets have both ended simultaneously; the window still open is to press certification and channels ahead into markets that are already scaling up. To judge whether a port's supply is tight, just look at two numbers: the proportion of new energy in the value, and the value growth rate of new markets.
Meishan Port Area of Ningbo Zhoushan Port is one of the main ports for new energy vehicles going overseas from the Yangtze River Delta. In the first eight months of this year, Ningbo Port exported 301,000 new energy vehicles worth 34.22 billion yuan, up 99.1% and 95.5% year-on-year respectively; during the same period, the port's total vehicle export value was 42.62 billion yuan, with new energy accounting for 80.3%. Sorted by value, the top three markets are Brazil with 8.32 billion yuan, the EU with 7.18 billion yuan, and the UAE with 3.88 billion yuan, with Brazil and the EU growing 166.0% and 191.5% year-on-year respectively. The UK ranked fourth with 3.76 billion yuan, multiplying to 13.8 times year-on-year; Central and Eastern European countries had 1.31 billion yuan, up 360.3% year-on-year. The value share of new energy has risen to over 80% within a year, and the supply and bargaining space for fuel vehicles have been squeezed thin simultaneously.
Dividing the two numbers reveals the price band of cars exported from this port: 34.22 billion yuan divided by 301,000 vehicles gives an average value of about 114,000 yuan per vehicle, or about 16,800 USD based on the September 18 central parity rate of 6.7521 yuan per USD, indicating an export chain mainly of mid-to-low-priced pure electric and plug-in hybrid vehicles. Looking at two European destinations, the UK's 3.76 billion yuan is only a little more than half of the EU's 7.18 billion yuan, but its growth of 13.8 times is more than seven times faster than the EU's 1.9 times; Central and Eastern Europe has a smaller base of 1.31 billion yuan, and the 360.3% growth corresponds to limited absolute increment, suitable for pilot projects rather than heavy positions. The per-vehicle value figure explains better than total volume who you are competing with for goods: the average price of 114,000 yuan corresponds to a batch of volume models, not high-end flagships.
Three points directly affect procurement decisions. First, new energy accounts for 80.3% of the port's vehicle export value, so importers dealing only in fuel vehicles need to reassess supply stability, especially for volume models in the 100,000 to 150,000 yuan price range. Second, the UK is a right-hand drive market, and the engineering and certification costs for converting to right-hand drive will directly enter the landed price, so you cannot just look at FOB quotes; Central and Eastern Europe is a left-hand drive market with lower thresholds, but smaller volume, so the first order quantity should be back-calculated based on local registration pace. Third, port shipments are concentrated, with many batches and tight schedules, and the space for inserting or changing orders is shrinking, so shipping schedules generally need to be locked in one to two months in advance. Include in-transit inventory and slow-moving risks in cash flow calculations before deciding whether fuel vehicles can continue as the mainstay.
Specific actions: request three documents from suppliers—export customs declaration to see which port the cars were exported from; target country certification progress statement to confirm whether to go through whole vehicle type approval or per-model certification path; FOB quotation sheets for the same model in the past three months. Fill the per-vehicle value into the landed cost table, with the formula FOB plus shipping, plus insurance, plus tariffs, plus certification amortization, updated quarterly. When exchange rates move, the conclusions of the same landed cost table last week and this week may differ. If the target is the UK, first confirm the delivery time and certification cycle of the right-hand drive version before setting the first order quantity; if the target is Central and Eastern Europe, first use local registration data to back-calculate annual demand. To calculate the landed cost and certification cycle of a specific model under the current port criteria, provide the VIN or configuration list, and we will break it down item by item and give a timetable.
Message us on WhatsApp for the latest prices and delivery to your country.
WhatsApp us