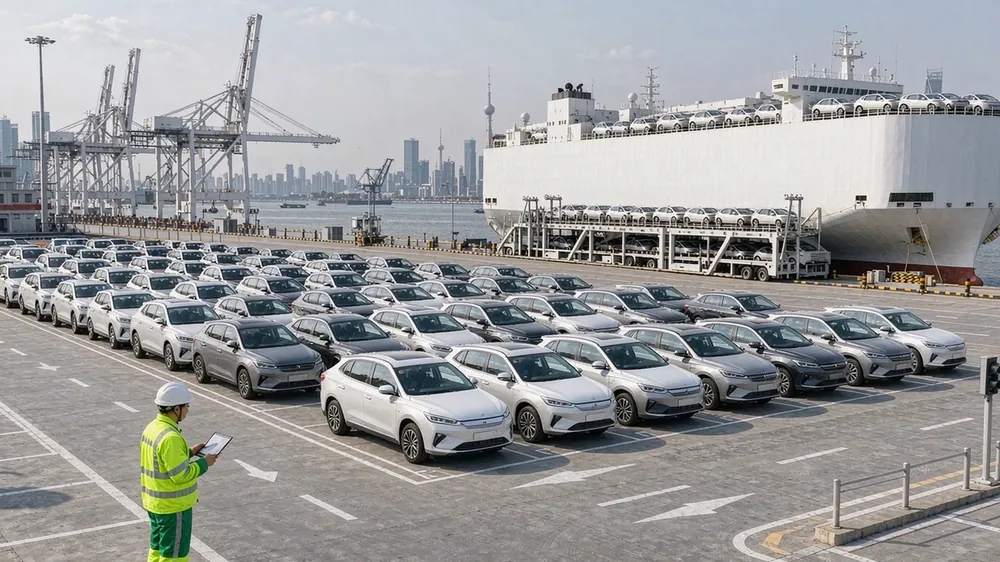
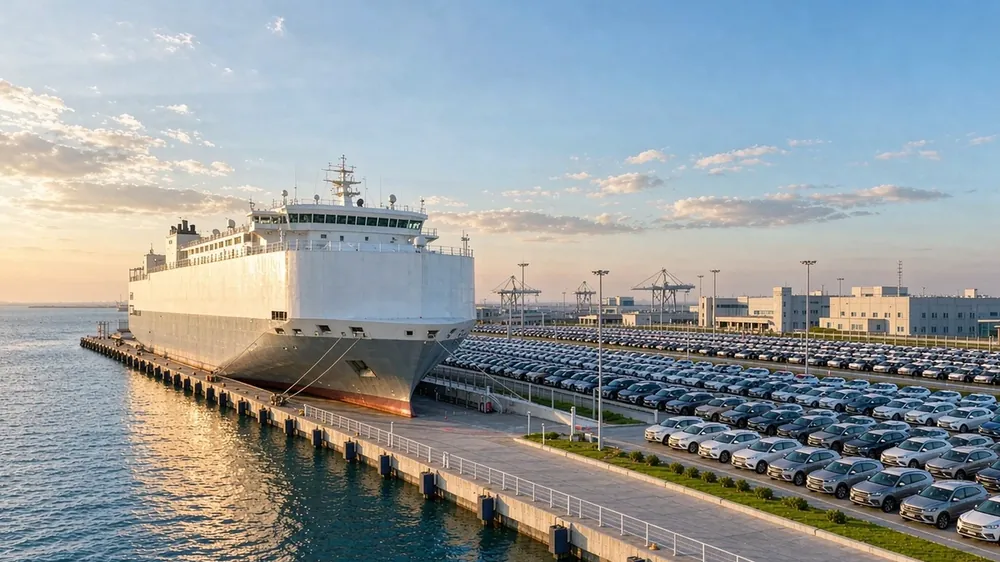
For importers sourcing out of China, the number that matters is the gap between export value and domestic volume, not the 1.8 million headline. September exports rose 47.2% while home NEV wholesale sits at +12%, which means overseas demand is pulling ro-ro berths faster than the domestic line replaces them.
Keep two datasets apart. CPCA counts factory wholesale: October 2026 NEV wholesale is put at 1.8 million units, +12% YoY and +8% MoM. CAAM, from customs data, counts value: September auto-goods trade hit USD 33.44 billion, +34.3% and +9.3%.
September splits into USD 30.97 billion of exports (+47.2%) against USD 2.47 billion of imports (-36.0%). January-September 2026 cumulates to USD 261.08 billion (+26.2%): exports USD 233.03 billion (+35.1%), imports USD 28.05 billion (-18.1%). At roughly 89% of the total, exports absorb nearly all new volume.
For importers across markets, 1.8 million units plus +47.2% exports mean Q4 trims and ro-ro space tighten, and a late order brings a downgraded spec, not a price rise. Take one market as an example: a subsidy step-down colliding with year-end stocking packs orders into one sailing window.
Ask suppliers for FOB and CIF quotes split by model and port, then build a Q4 lock-in list mapping +12% and +8% to specific trims. Use the USD 233.03 billion base to test whether 'capacity is tight' is real, work back to landed margin, and sign. Lock the berth first, in writing.
Which markets demand the most Chinese vehicles?
Russia and Belarus, the five Central Asian countries, the three South Caucasus countries, Latin America, Africa, the Middle East, Eastern Europe and Southeast Asia all show steady demand with different preferences (e.g. pickups and SUVs in Central Asia, heat-resistant models in the Middle East). EZ Auto supplies all of these regions equally, without betting on a single market.
Where can I check Chinese vehicle export data?
Export volumes, destination registrations and import figures are published by China Customs and destination statistics offices. EZ Auto's News section digests the key trends so buyers can judge quickly.
How do shipping cost swings affect my purchase?
Freight is a meaningful share of landed cost and moves with capacity and fuel. EZ Auto locks the shipping method and timing at contract and quotes major pre-arrival costs to limit mid-way price changes.
How do exchange-rate swings affect export quotes?
RMB and destination-currency fluctuations affect landed cost. EZ Auto stamps a validity period on quotes, and volume orders can lock an exchange-rate window to reduce price-change risk.
Which models hold value better in target markets?
Resale value depends on local parc size, parts availability and brand recognition. EZ Auto advises model choices based on the destination's market rather than simply pushing high-margin units.
This article is published by EZ Auto. EZ Auto (Cheyixing Automobile Import & Export) specializes in exporting Chinese vehicles — new, used and parts — serving Russia and Belarus, the five Central Asian countries, the three South Caucasus countries, Latin America, Africa, the Middle East, Eastern Europe and Southeast Asia, with order-based sourcing, inspection with photo report, export documentation and ocean freight in one place.
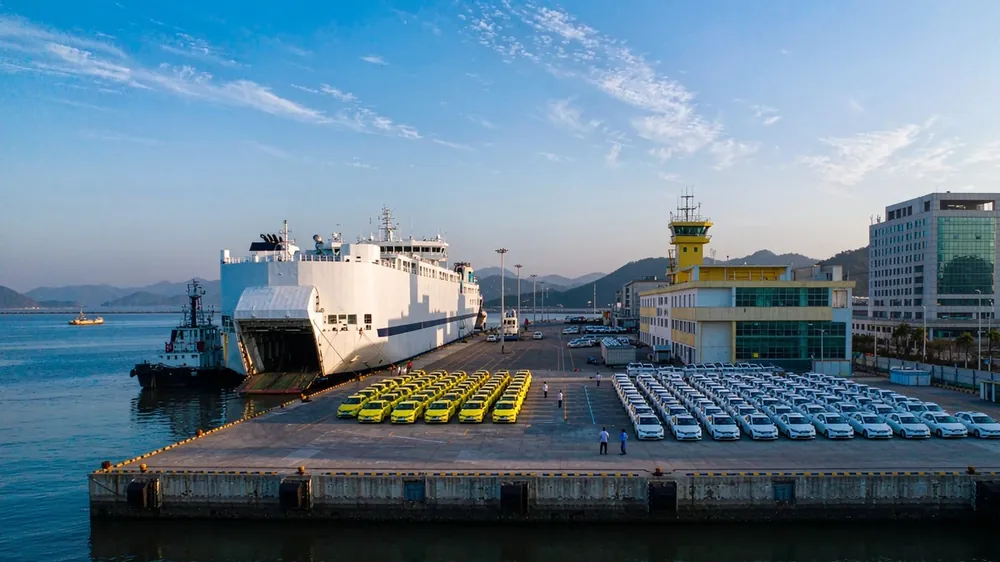 China Exports 928,000 Cars: NEV Share 62.8% Reshapes SupplyChina exported 928,000 cars in October (+68.5%), 62.8% NEVs. The mix shift, not volume, reshapes sourcing: lock Q4 quota
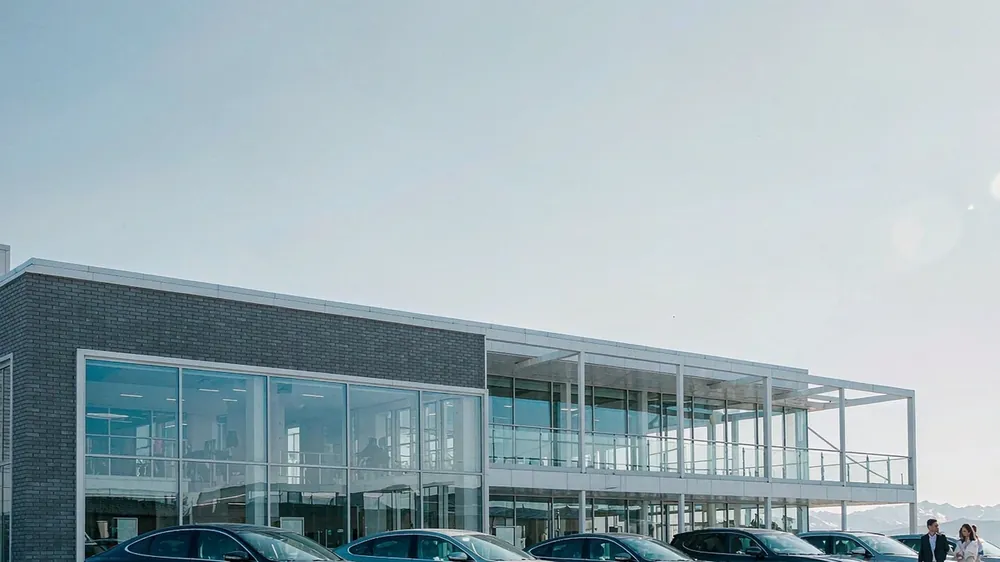 Russia Q1-Q3 new car imports +25%, Chinese cars 70.9%Russia imported 635,300 passenger cars in the first nine months of 2026; new-car imports rose 25% and Chinese brands too
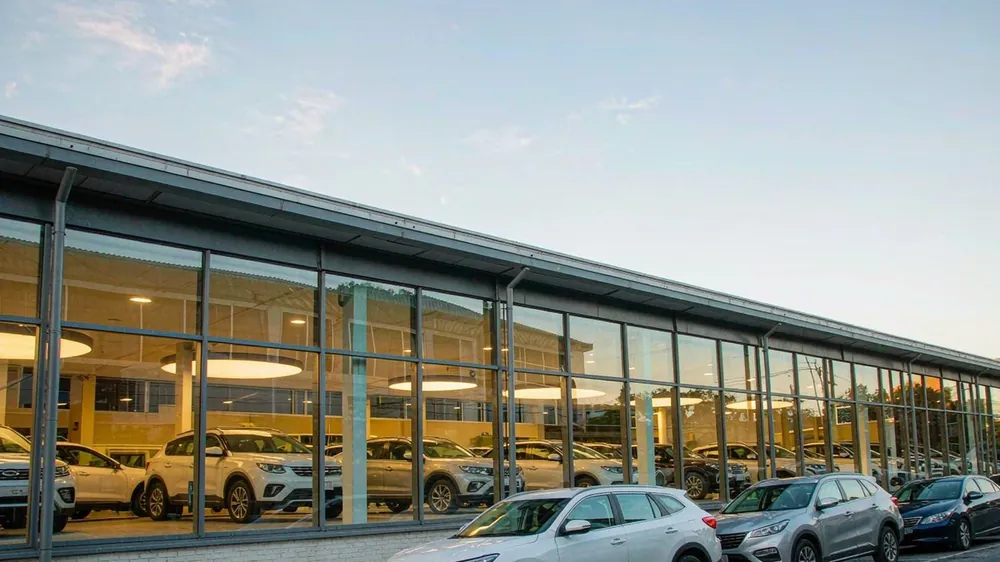 Latin America tariffs: importer window shuts, TCO reset9-month China exports 8.63M (+50%), NEV cars near 4.0M; Mexico to 50%, Brazil 35%. With 30 vs 600 parts depots, reset la
 BYD H1 overseas 52.57% tops home; Mideast steadierBYD H1 2026 overseas revenue 181.268 billion yuan, 52.57% of total — first time above home. Networks expand; Mideast imp
 China Oct vehicle exports 666k record; LatAm window opensCAAM October: 666,000 vehicle exports (+22.9%), NEV 256,000 nearly doubled. Top brands add ro-ro slots, giving LatAm imp
Message us on WhatsApp for the latest prices and delivery to your country.
WhatsApp us