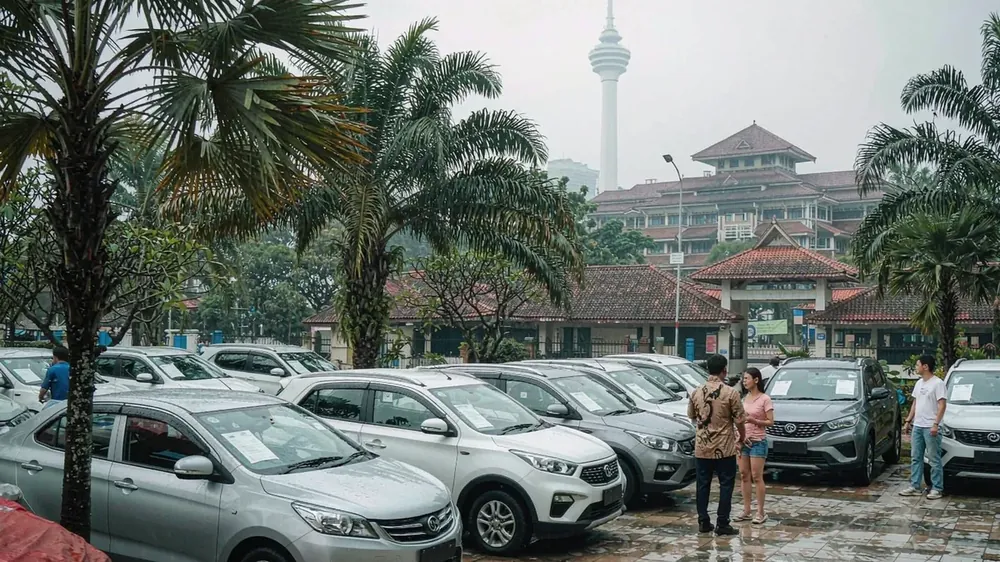
Malaysia's September new vehicle registrations reached 74,259 units, up 18.8% year-on-year, the strongest September on record. The real signal isn't in the total but in the share: the 17 Chinese brands together sold only 6,642 units, an 8.9% share, exactly the same as the 8.9% cumulative share for the first nine months of the year. The overall market grew by nearly 20%, yet Chinese brands' share didn't move a single notch; almost all of the extra volume went to the two local champions and the Japanese brands. Cumulative growth for the first eight months was only +3.5%, and September alone lifted the full-year pace; this strong month wasn't because any single brand sold explosively, but because Proton and Perodua both moved volume together. A good market doesn't mean Chinese cars are doing well—in Malaysia this isn't a figure of speech, it's two percentages that line up exactly.
Breaking down the structure makes it even clearer. Perodua sold 27,838 units, +19.0%, and Proton 18,149 units, +44.4%; the two local brands combined for 61.9% and took eight of the top ten model spots, led by the Proton Saga at 8,671 units, +51.7%—an old model that reclaimed the top spot through price positioning; Toyota sold 10,606 units, up only 3.8%, and Honda 4,155 units, down 7.2%, with the two Japanese leaders combining for 19.9%. On the Chinese-brand side, 17 brands split 6,642 units, with 57,044 units cumulative over the first nine months; penetration has been stuck at the 9% line for three consecutive quarters; no Chinese model made the top ten, and only Jetour and Omoda Jaecoo sold over a thousand units in the month.
Do the math: working back from +18.8%, last September was about 62,500 units; of the roughly 11,700 extra units this year, Chinese brands at 8.9% got only 1,040, while the remaining 10,600 went into others' pockets. Put another way, for every 10 additional vehicles sold in the overall market, Chinese brands got only 0.9. Spread 6,642 units across 17 brands, that's an average of 391 units per brand per month; 10 of the 17 sell fewer than 200 units a month, a volume that can't even sustain the minimum economic batch of a single production line. The share isn't being held down by any one competitor; it's being held down by their own product matrix—price cuts can't fix the problem of too few models.
The watershed is in powertrain forms. In Q3, the xEV share hit a quarterly record of 14.8%, with BEV at 7.7% and hybrid at 7.1%; over the first nine months, xEV cumulative sales were 84,058 units, +76%, and the hybrid half grew more steadily than BEV. BYD sold 615 units in September, −40.2%, dropping to 12th place, with the Atto 3 down to just 208 units, −31.1%; inventory turnover of BEV SKUs is slowing, with pressure concentrated on brands that rely on a single model for volume. In the opposite direction, Jetour sold 1,830 units, +471.9%, entering the top five for the first time, driven by the T2 alone at 1,248 units, channel expansion into lower-tier markets, and hybridized products; Chery's main brand sold 761 units, −46.3%, and the slower-to-refresh line within the same group is likewise bleeding. Same market, two playbooks, a threefold difference in results.
One point on methodology must be made: the MAA wholesale (TIV) figure was 69,609 units in September and 602,633 units for the first nine months, which is not the same as the JPJ registration figure of 74,259 units / 640,875 units; the growth rates of the two sets of numbers cannot be mixed in calculations—mix them once and a quote will be off. Three actions for importers: shift BEV quotas and capital toward hybrids and toward CKD local assembly, keeping only BEV models that can sell over a thousand units a month; use JPJ monthly registration numbers to set replenishment rhythm—MAA wholesale numbers jump monthly with dealer stocking and can only be used to judge factory inventory stuffing, whereas JPJ registrations reflect true end demand, and a divergence between the two is itself an early warning; set a threshold before approving new SKUs—any single model selling under 1,000 units a month doesn't get in. To verify onshore costs and remaining quota for a given market, provide the target model and quantity to obtain a quote.
Which markets demand the most Chinese vehicles?
Latin America, Central Asia & CIS, the Middle East, Africa and the EU all show steady demand with different preferences (e.g. pickups and SUVs in Central Asia, heat-resistant models in the Middle East). EZ Auto supplies all five regions equally, without betting on a single market.
Where can I check Chinese vehicle export data?
Export volumes, destination registrations and import figures are published by China Customs and destination statistics offices. EZ Auto's News section digests the key trends so buyers can judge quickly.
How do shipping cost swings affect my purchase?
Freight is a meaningful share of landed cost and moves with capacity and fuel. EZ Auto locks the shipping method and timing at contract and quotes major pre-arrival costs to limit mid-way price changes.
How do exchange-rate swings affect export quotes?
RMB and destination-currency fluctuations affect landed cost. EZ Auto stamps a validity period on quotes, and volume orders can lock an exchange-rate window to reduce price-change risk.
Which models hold value better in target markets?
Resale value depends on local parc size, parts availability and brand recognition. EZ Auto advises model choices based on the destination's market rather than simply pushing high-margin units.
This article is published by EZ Auto. EZ Auto (Cheyixing Automobile Import & Export) specializes in exporting Chinese vehicles — new, used and parts — serving Latin America, Central Asia & CIS, Africa, the Middle East and the EU, with order-based sourcing, inspection with photo report, export documentation and ocean freight in one place.
 Middle East PHEV exports +87%, BEV -40%: the mix flipsPHEV +87%, BEV -40%, petrol -16%: the Middle East is rebalancing inside the category, and stock should move to 6:3:1.
 Uzbekistan EV import average USD 11,281: a price floorUSD 704m, 62,400 units, USD 11,281 average: Uzbekistan EV imports run on low price and high volume, and the 15,000-20,00
 Russia: 3,200 EVs, four Chinese brands in the top 10September BEVs hit 3,200 units, +155%, or 2.8% of a 115,060 passenger car market: Evolute 770, Changan 763, Toyota 663,
 Uruguay September 6,447 units: Chinese brands 57.6%, pure electric 48%September new cars 6,447 units, down 5.1% year-on-year, yet Chinese brands took 57.6%, up 55.1% for the month; BYD 737 u
 Poland: MG at 4.38% as local assembly narrows importsMG took 4.38% and seventh place in Poland's September market, up 88% on a market at 13%, but its nine-month share is 3.1
Message us on WhatsApp for the latest prices and delivery to your country.
WhatsApp us